
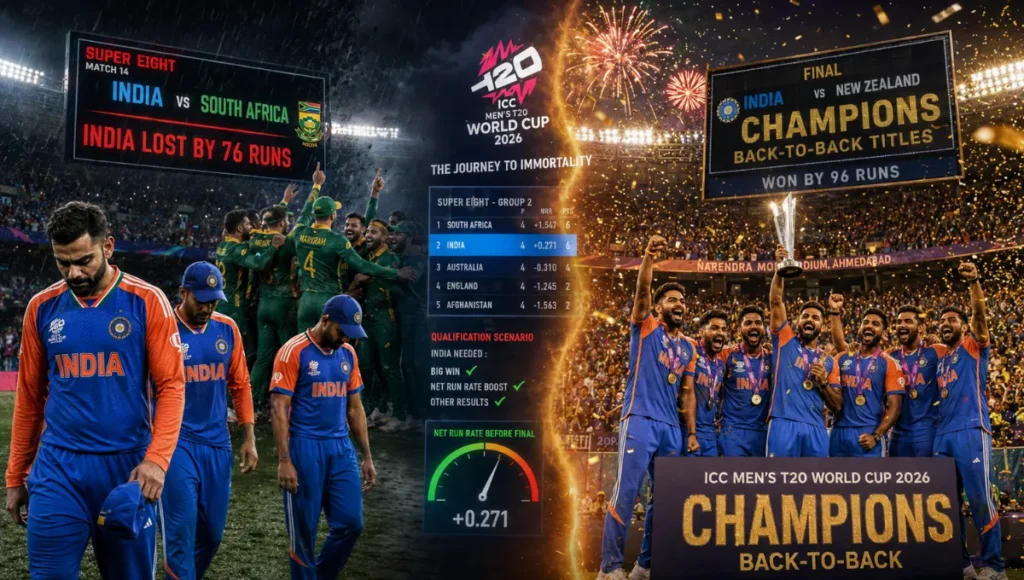

India lost to South Africa by 76 runs in the Super Eight stage of the 2026 T20 World Cup. A week later, they lifted the trophy, becoming the first team ever to defend a T20 World Cup title.
But here’s the real problem: most coverage of the T20 World Cup standings gives you a static points table snapshot, but never explains how a team can suffer a blowout defeat and still walk away as champions.
The 2026 ICC Men’s T20 World Cup ran from February 7 to March 8, 2026, hosted jointly by India and Sri Lanka. India beat New Zealand by 96 runs in the final at Narendra Modi Stadium, Ahmedabad, becoming the first team in history to win back-to-back T20 World Cup titles.
What most people miss is that the group-stage and Super Eight standings weren’t just a formality on the way to the final they involved a genuine net run rate scare for the eventual champions.
Tournament Summary at a Glance
| Detail | Information |
|---|---|
| Dates | February 7 – March 8, 2026 |
| Hosts | India and Sri Lanka |
| Champions | India (3rd title) |
| Runners-up | New Zealand |
| Final result | India won by 96 runs |
| Final venue | Narendra Modi Stadium, Ahmedabad |
| Historic first | First team to successfully defend the T20 World Cup title |
This is where things go wrong for anyone assuming a dominant group-stage table guarantees a smooth run to the final: India’s path included a genuinely rocky Super Eight stage that tested their qualification math right up to the final round of group matches.
Group Stage Standings Explained
The tournament began with four groups of five teams each, and India topped Group A comfortably despite a slow start to their net run rate.
Group A Final Standings
| Pos | Team | Played | Won | Lost | Points | NRR |
|---|---|---|---|---|---|---|
| 1 (Q) | India | 4 | 4 | 0 | 8 | +2.500 |
| 2 (Q) | Pakistan | 4 | 3 | 1 | 6 | +0.976 |
| 3 | United States | 4 | 2 | 2 | 4 | +0.788 |
| 4 | Netherlands | 4 | 1 | 3 | 2 | -1.217 |
| 5 | Namibia | 4 | 0 | 4 | 0 | -3.108 |
Read Also:- India vs Sri Lanka Tri Series 2026: Final Highlights & Key Moments
India’s group-stage NRR of +2.500 looks emphatic in hindsight, and it’s exactly this cushion that would matter far more than most fans realized once the Super Eight stage began.
Other Group Winners
| Group | Winner | Runner-Up |
|---|---|---|
| Group B | Zimbabwe | Sri Lanka |
| Group C | West Indies | England |
| Group D | South Africa | New Zealand |
Common mistake fans make when scanning group tables like these: assuming every group winner is a genuine title contender. Zimbabwe topped Group B with a strong NRR of +1.506, yet they were eliminated in the very next stage without winning a single Super Eight match.
Super Eight Standings: The Real Qualification Drama
This is where the tournament’s genuine tension lived, and it’s the part every competitor table glosses over. In Super Eight Group 1, India suffered a 76-run defeat to South Africa at their own home ground in Ahmedabad.
Super Eight Group 1 Final Standings
| Pos | Team | Played | Won | Lost | Points | NRR |
|---|---|---|---|---|---|---|
| 1 (Q) | South Africa | 3 | 3 | 0 | 6 | +2.259 |
| 2 (Q) | India | 3 | 2 | 1 | 4 | +0.106 |
| 3 | West Indies | 3 | 1 | 2 | 2 | +0.993 |
| 4 | Zimbabwe | 3 | 0 | 3 | 0 | -3.415 |
India’s net run rate dropped sharply to just +0.106 after the South Africa defeat, but it stayed positive precisely because of the massive winning margins they’d built up during the group stage. The team qualified for the semifinal by beating West Indies by 5 wickets in their final Super Eight match at Eden Gardens on March 1, sealing the second qualification spot from the group with 4 points.
Super Eight Group 2 Final Standings
| Pos | Team | Played | Won | Lost | Points | NRR |
|---|---|---|---|---|---|---|
| 1 (Q) | England | 3 | 3 | 0 | 6 | +1.096 |
| 2 (Q) | New Zealand | 3 | 1 | 1 | 3 | +1.390 |
| 3 | Pakistan | 3 | 1 | 1 | 3 | -0.123 |
| 4 | Sri Lanka | 3 | 0 | 3 | 0 | -1.950 |
New Zealand pipped Pakistan for the second semifinal spot despite both teams finishing with identical points, purely on net run rate New Zealand’s superior NRR of +1.390 against Pakistan’s -0.123 made the difference.
What people think vs reality: most fans assume winning more matches automatically secures qualification. Reality, New Zealand and Pakistan both had exactly one win and one loss with one match affected by no-result, yet New Zealand’s stronger scoring margins across those matches decided who advanced.
How Net Run Rate Decided the Semifinal Race
Net run rate is calculated as the average runs a team scores per over minus the average runs they concede per over, across every match in that stage.
Here’s the practical way to actually apply it: if a team wins big and loses narrowly, their NRR stays healthy; if they win narrowly and lose big, it collapses fast which is exactly what nearly happened to India.
- India’s group-stage blowout wins built an NRR cushion of +2.500, giving them a buffer heading into the tougher Super Eight matches
- The 76-run defeat to South Africa dragged that number down to +0.106 by the end of the Super Eight stage, a genuinely precarious position with one match remaining
- India’s final Super Eight win over West Indies by 5 wickets was enough to lock in qualification without needing a dramatic swing in NRR, since their remaining group-stage cushion still held
This is a genuinely bold but accurate observation: India’s title defense was closer to unraveling at the Super Eight stage than most retrospective coverage admits, and crediting it purely to “dominance” ignores how much their group-stage NRR banking saved them.
Semi-Finals and the Final: From Table to Trophy
The semifinals paired the two group toppers against the runners-up from the other group, and the results flipped a few pre-tournament assumptions.
- Semifinal 1: New Zealand beat South Africa by 9 wickets in Kolkata, eliminating the Super Eight Group 1 table-toppers in one of the tournament’s biggest upsets
- Semifinal 2: India beat England to reach their second consecutive final
The Final: India vs New Zealand (March 8, 2026, Ahmedabad)
New Zealand won the toss and chose to field first, a decision that backfired severely.
| Team | Score | Result |
|---|---|---|
| India | 255/5 (20 overs) | Won by 96 runs |
| New Zealand | 159 all out (19 overs) | — |
Sanju Samson scored 89 runs, with Ishan Kishan and Abhishek Sharma also contributing fifties, powering India to 255/5. Jasprit Bumrah then took 4 wickets, dismantling New Zealand’s chase and sealing India’s historic third T20 World Cup title, and their first successful title defense in the format’s history.
Team Performance Breakdown
| Team | Group Stage | Super Eight | Final Result |
|---|---|---|---|
| India | Won Group A (8 pts) | 2nd in Group 1, NRR dropped to +0.106 | Champions |
| New Zealand | Runner-up, Group D | 2nd in Group 2 via NRR over Pakistan | Runners-up |
| South Africa | Won Group D | Topped Group 1, beat India by 76 runs | Lost semifinal to NZ |
| England | Runner-up, Group C | Topped Group 2 unbeaten | Lost semifinal to India |
| Zimbabwe | Won Group B | Finished bottom of Group 1 | Eliminated at Super Eight stage |
| Pakistan | Runner-up, Group A | Missed semifinal on NRR | Eliminated at Super Eight stage |
Read Also:- Ind Vs Eng ODI Squad 2026: Full Squads, Series Analysis
South Africa’s run deserves more attention than a single semifinal loss suggests topping their Super Eight group with a dominant NRR of +2.259, including a 76-run demolition of the defending champions, only to lose the semifinal by 9 wickets is one of the tournament’s most dramatic form reversals.
What People Think vs What Actually Happened
Most fans assume a team suffering a 76-run defeat during a crucial qualification stage is in genuine danger of elimination.
Reality: India’s net run rate, even after that heavy loss, stayed positive at +0.106, comfortably enough to control their own qualification with one match remaining. The common mistake fans make is judging a team’s tournament standing purely by their most recent result rather than checking the cumulative net run rate built across every match in that stage India’s group-stage form did the heavy lifting long before the Super Eight defeat ever happened.
Key Takeaways for Fans
- Always check cumulative net run rate, not just recent results, when assessing a team’s real qualification risk India’s group-stage blowouts protected them through a bad Super Eight loss
- New Zealand and Pakistan finishing level on points in Super Eight Group 2 shows how often net run rate, not wins alone, actually decides semifinal qualification
- South Africa’s Super Eight dominance (including beating India by 76 runs) proves that topping a qualification table doesn’t guarantee anything once the knockout stage begins
- India’s back-to-back T20 World Cup titles (2024 and 2026) is now the format’s defining recent storyline and should be the benchmark for judging future champions
- Track group-stage NRR margins closely if you’re following a team through a multi-stage tournament — a big group-stage win can be the exact cushion that saves a campaign later